An overview of the descriptive analytics repository and why contextual, sub-population-aware analysis is essential before modeling business data.
A critical essay on the limits of one-size-fits-all AI approaches for complex analytical problems that require domain rigor and validated assumptions.
A practical test drive of using ChatGPT and Copilot for time series data analysis on retail ice cream sales, including preprocessing and diagnostic questions.
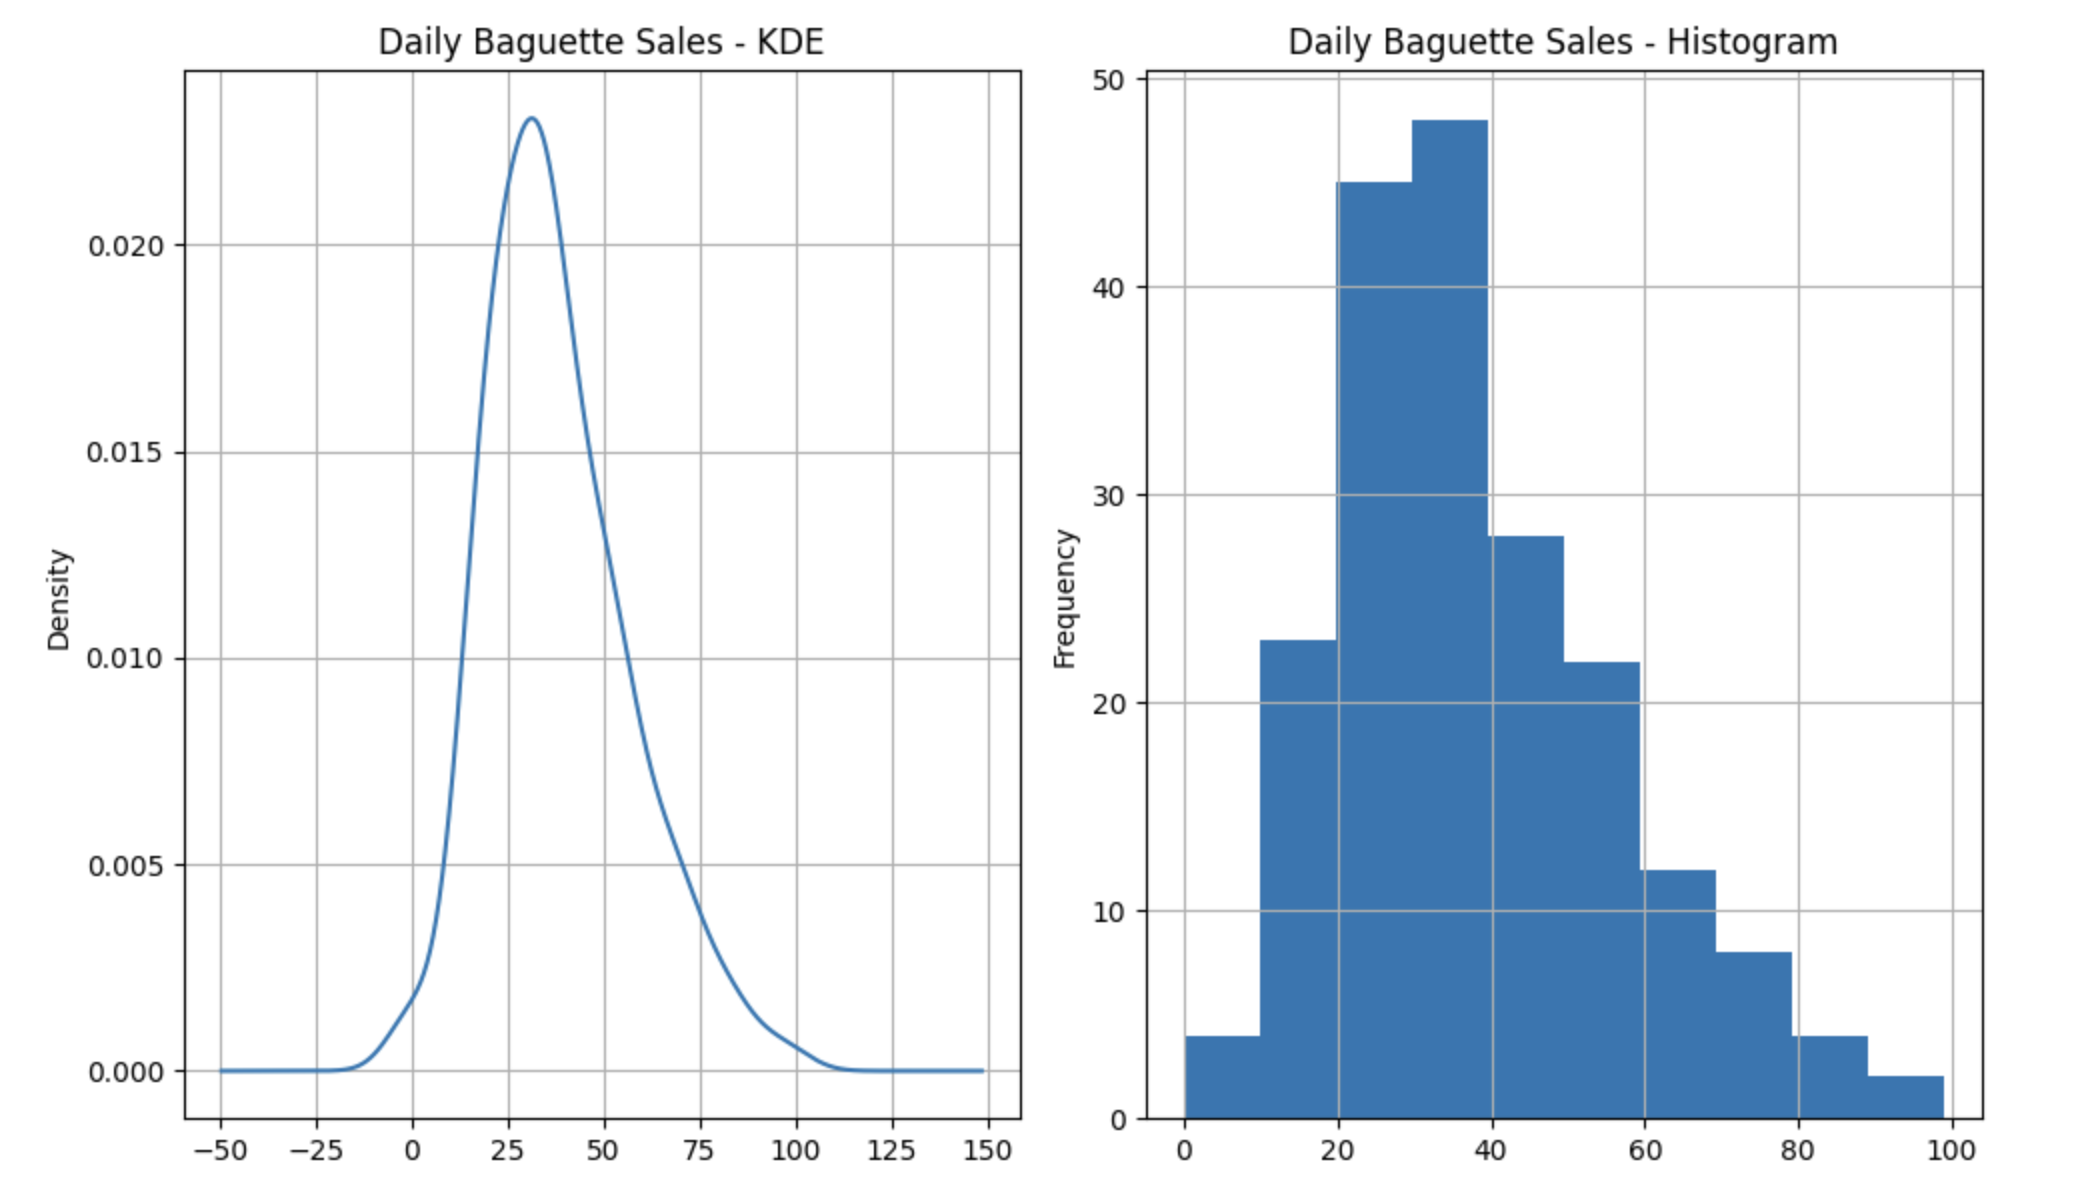
An applied introduction to stochastic optimization for bakery demand planning, showing how statistical estimation drives optimization decisions under uncertainty.
A descriptive analytics sketch of Olist customer shopping behavior in Sao Paulo for 2017, focused on market structure and practical data reduction.
An introduction to heterogeneity in cross-sectional, longitudinal, and panel data, with practical modeling implications for random effects and graph-based methods.
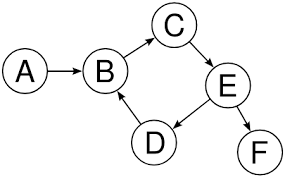
How to derive graph-based descriptive analytics from relational/tabular data to handle non-IID structure and improve modeling strategy.
Why experimentation and iteration remain central to data science workflows, even with modern AI coding assistants and faster prototyping tools.
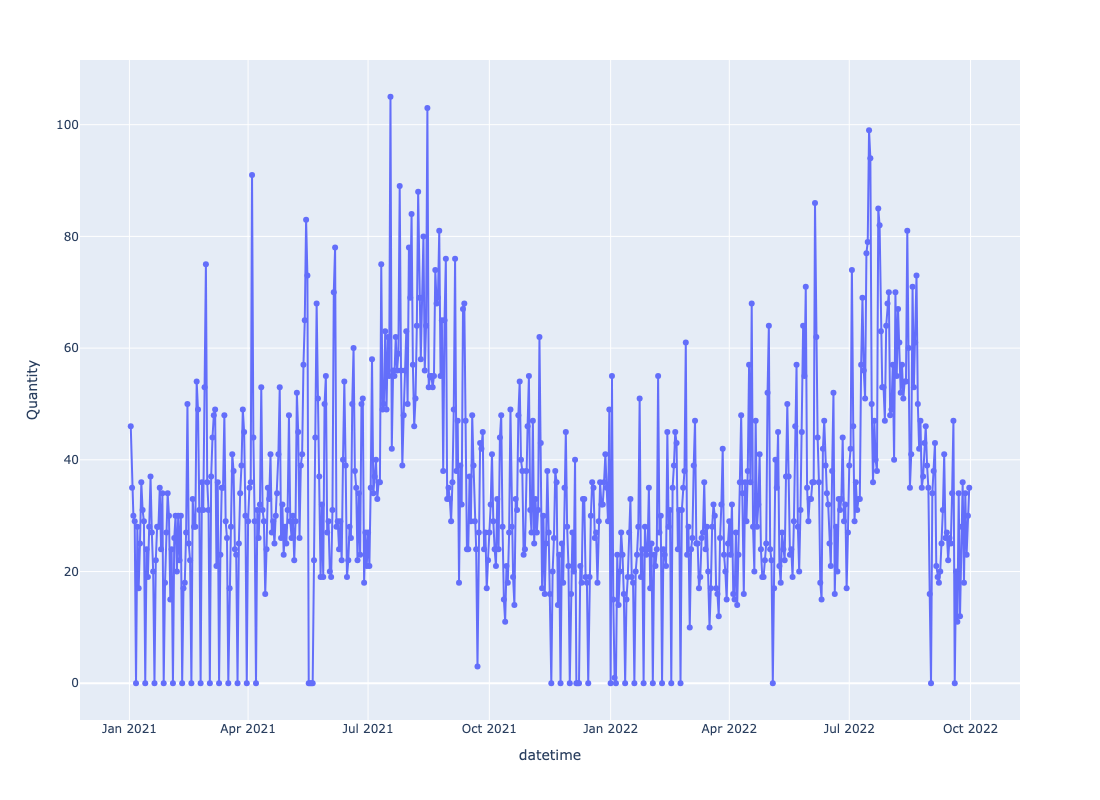
A practical reflection on why model accuracy is not the only goal in data science, with a bakery time series example using trend and seasonality diagnostics.
Why descriptive analytics is essential before predictive modeling, with a practical retail transaction case study and reproducible notebook resources.
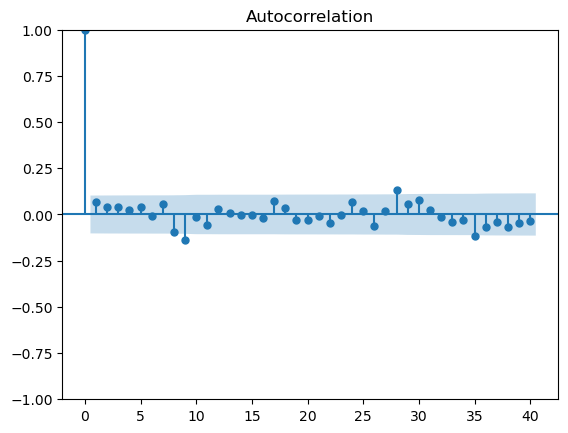
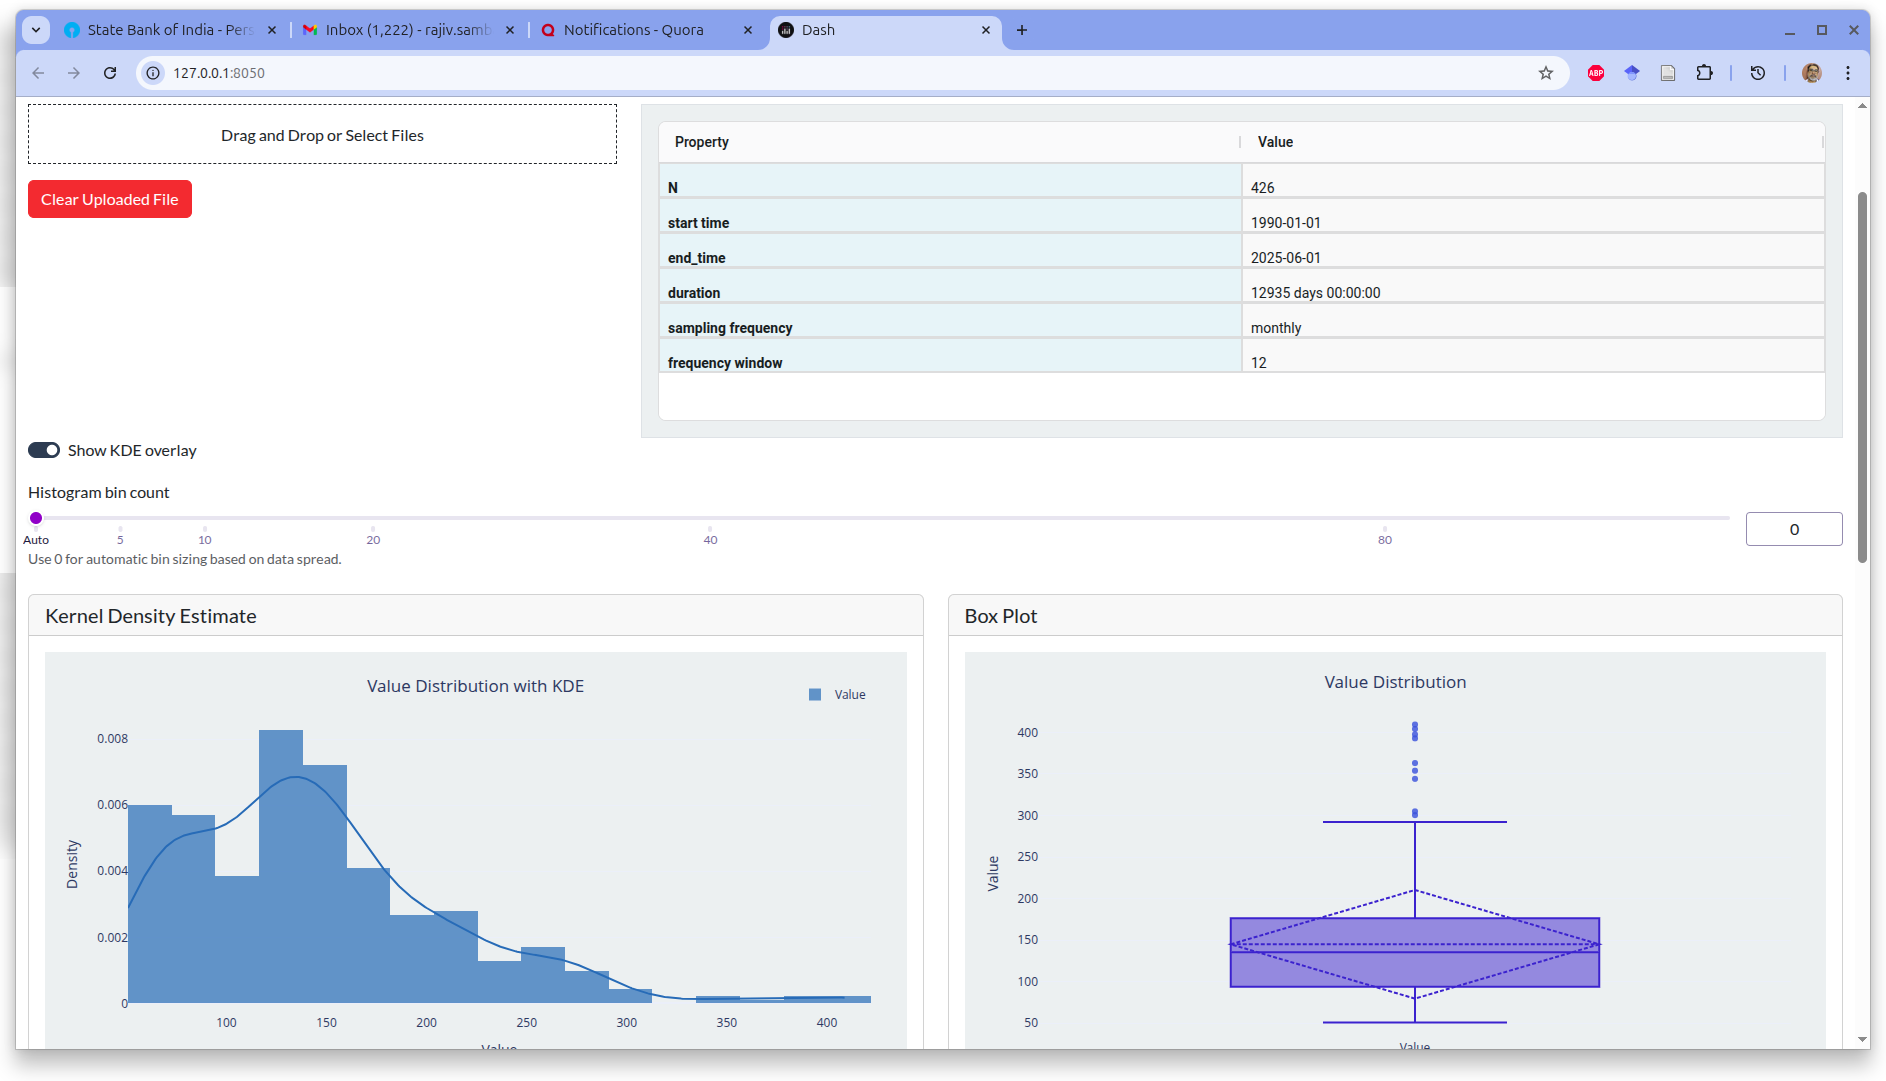
Announcing tseda, a Python package and Dash app for fast time series exploratory data analysis with SSA decomposition, ACF/PACF diagnostics, and AIC-based model rank selection.
This article addresses graph learning, unsupervised learning, graph signal processing, Laplacian estimation, total variation smoothing, manifold regularization, and anomaly detection for state-level SBA loan charge-off rates.
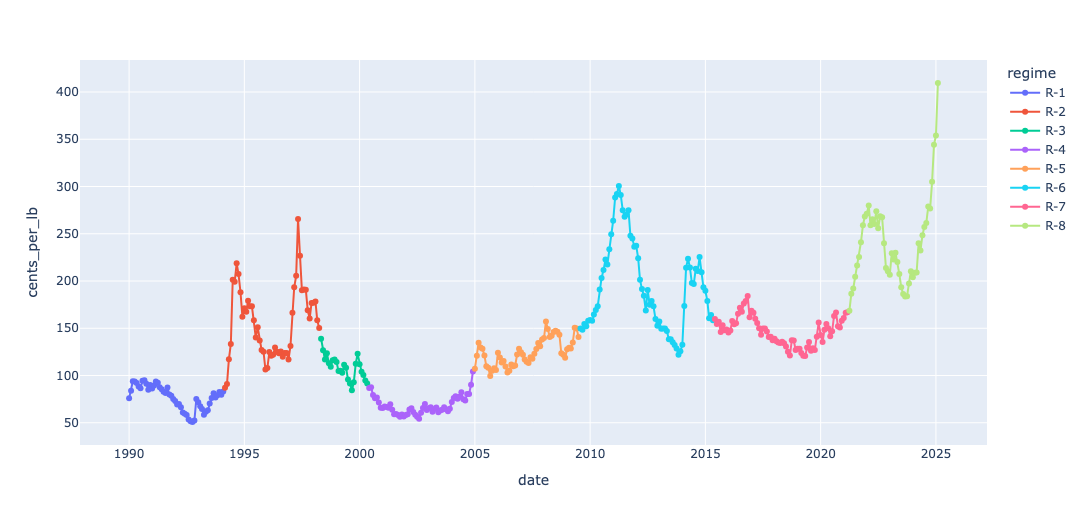
Master time series decomposition with Singular Spectrum Analysis (SSA). Explore practical examples using coffee prices, energy data, and car sales to identify trends, seasonality, and noise for better data insights.