A better version of this post will come soon.
Accuracy, the challenge for every data scientist, is it?
Is accuracy the ultimate goal of a data scientist’s work? A recent WhatsApp forward I received portrayed data scientists as being singularly focused on model accuracy, as if it were the sole purpose of the profession. This stereotype caught me off guard because, in my experience, the reality couldn’t be further from the truth.
For data scientists working with business applications, particularly those dealing with tabular data, the challenges are uniquely complex. While colleagues in fields like computer vision, natural language processing, or signal processing may face their own hurdles, their datasets—images, videos, documents, or audio—often appear more structured, with well-defined tasks such as segmentation, object recognition, or speech recognition. In contrast, business data often requires grappling with ambiguous problem definitions, messy datasets, and evolving objectives. Data scientists working with business data face a unique set of challenges. Often, the task begins with a vague directive: “If you can predict X, we can improve Y. Build a model to predict X.” This raises numerous open-ended questions and assumptions that need to be clarified before meaningful progress can be made.
Is there any preliminary evidence or pilot study suggesting that predicting X will indeed improve Y? While data science offers robust tools to validate such assumptions, in practice, we rarely get the opportunity to do so upfront. Often, the problem itself is framed incorrectly. Collaborating with your data science team to refine the problem statement and identify what truly drives Y can be far more impactful.
One of the most challenging aspects of data science is characterizing the dataset—understanding the factors that contribute to explaining the target variable. This complexity varies depending on the type of data you’re working with—be it longitudinal, cross-sectional, or panel data. Each type introduces unique sources of variation that must be accounted for to build meaningful models.
Coming to the accuracy question, say you have a noisy signal with which you are trying to predict something, let’s say your body temperature with a wearable device. The signal might have noise due to motion artifacts, environmental factors, or sensor limitations. In such cases, you may get a model that has wide confidence intervals for its predictions.
The real effort is in identifying what causes the errors - the motion artifacts, the variation in enviromental factors as well as sensor limitations. Building accurate models in this case may require sensors that are more reliable and techniques that reduce noise artifacts - the best you can do is explain why your predictions have a wide confidence interval. No amount of modeling sophistication if fixing this problem. You can throw your best neural network at it.
Achieving good accuracy is often an iterative process. We frequently start with no baseline or baselines that obscure flawed modeling assumptions. Personally, I don’t view accuracy as the ultimate goal; instead, I focus on understanding the limitations of the current accuracy. Accuracy is a reflection of how well we understand the data in the context of the task and the engineering efforts supporting it. Improving accuracy doesn’t always mean refining the model—it might require enhancing the data itself. Data improvement often demands collaboration and buy-in from sponsors and stakeholders. So, no, a lack of high accuracy is not necessarily a reflection of your modeling skills.
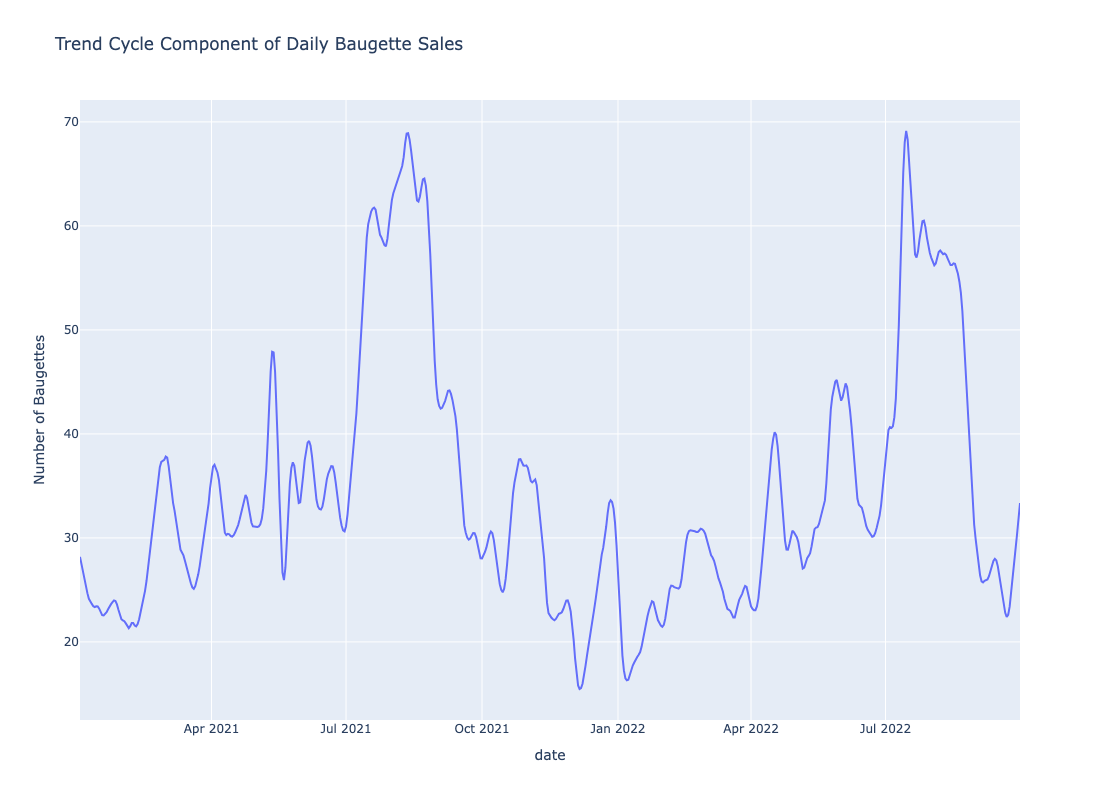
Switching to another topic, I was thinking about what I mentioned about identifying changepoints in my post about coffee prices. In it I was talking about visually analyzing the trend and seasonalities and then counting the change points. Could I show this with more clarity? So here is take 2 on a new dataset.
The problem setting is as follows, we have daily transaction data from a Bakery in the UK. The dataset is from Kaggle. Suppose we are interested in the number of baguette’s that are sold daily, we have a time series associated with this.
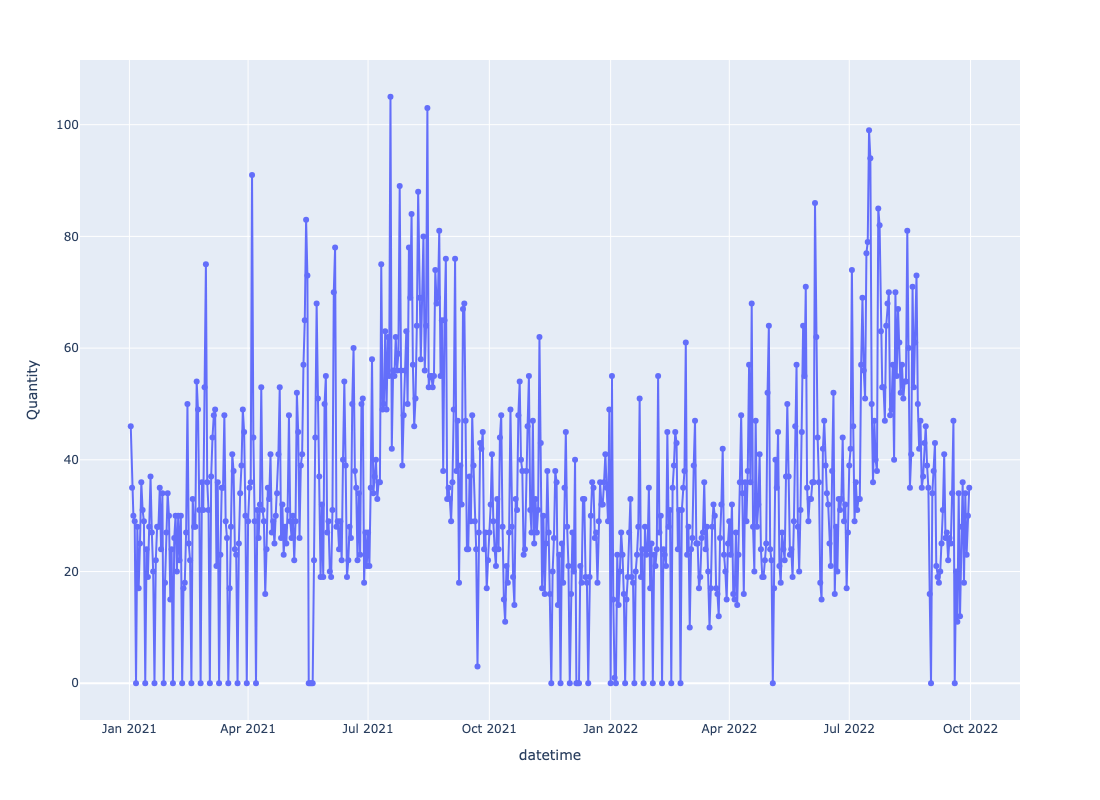
As with the coffee prices data, we run it through a time series decomposition algorithm and we get a trend cycle shown below:
The seasonality is shown below:
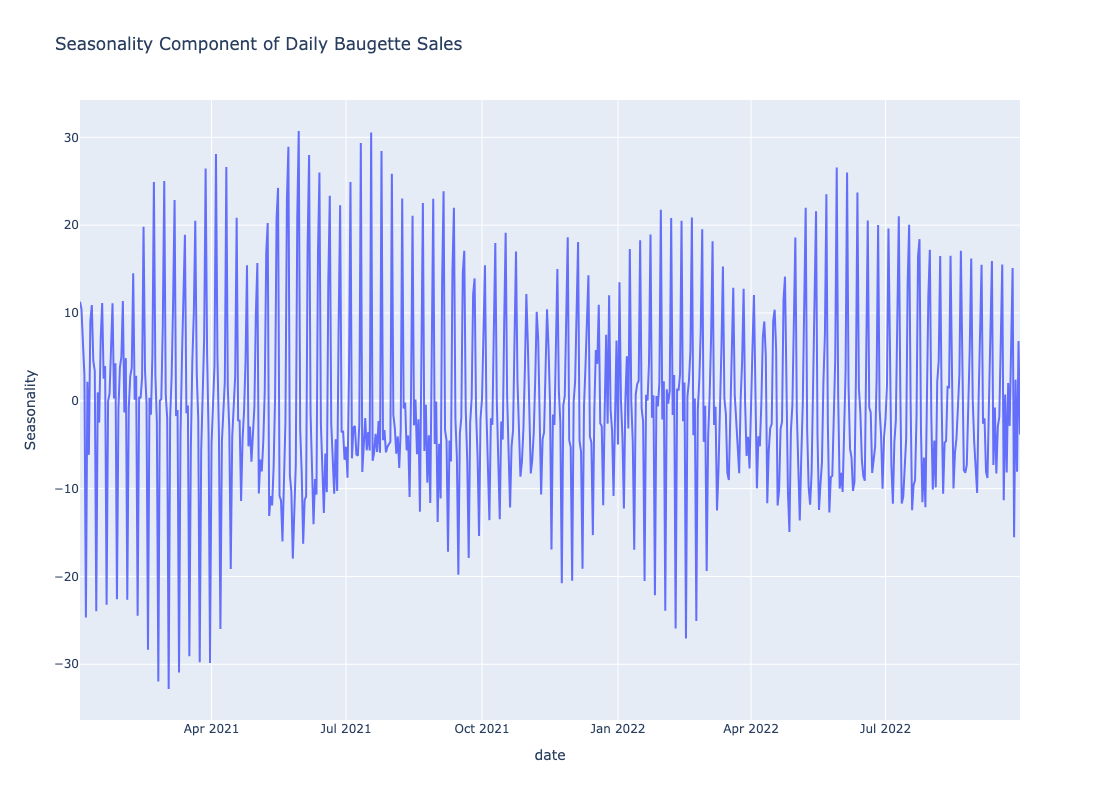
Visual inspection definitely shows different trend-cycles. Similarly, the seasonality plot also shows different seasoanalities. The question is how do we find the number of distinct trend components from the figure? Similarly, how do we find the number of seasonality components from the figure? I subsequently realized we can estimate this by simply plotting the KDE’s for the trend and seasonality.
Here is the KDE for the trend component:
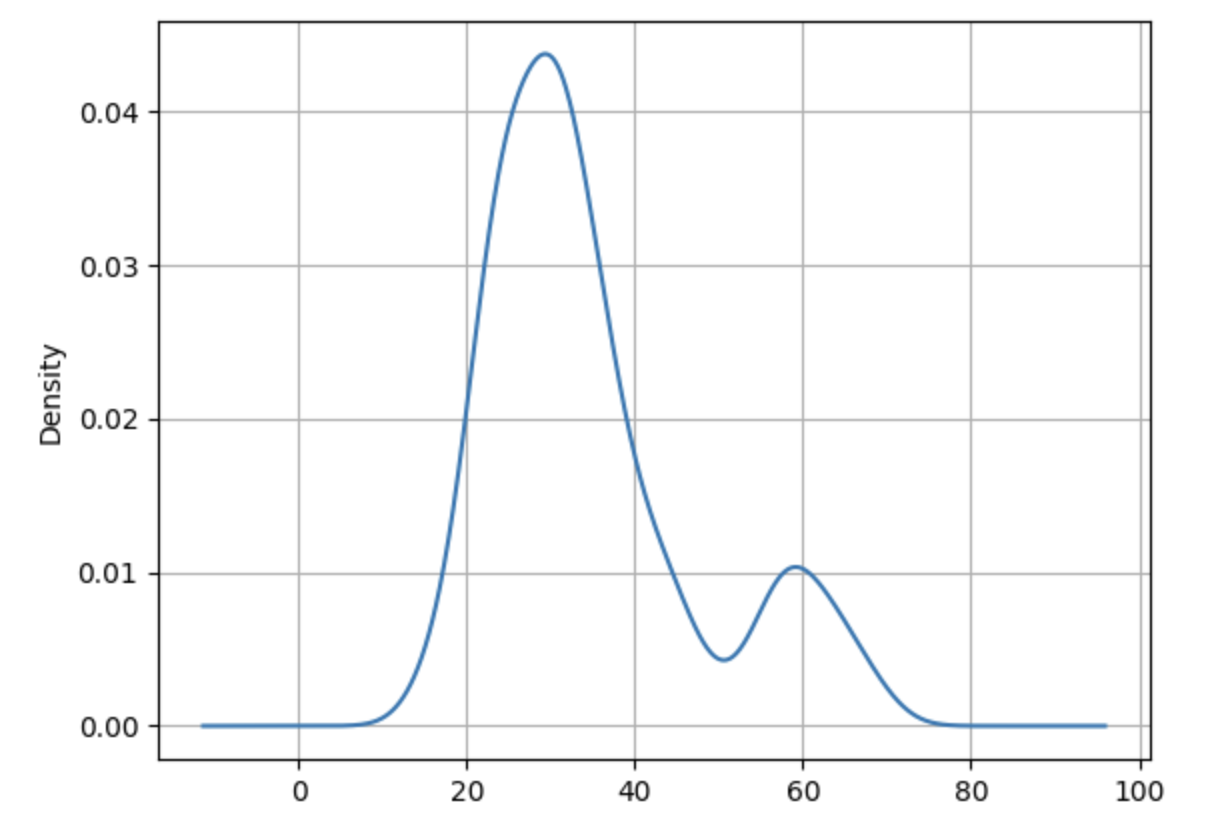
Here is the KDE for the seasonality component:
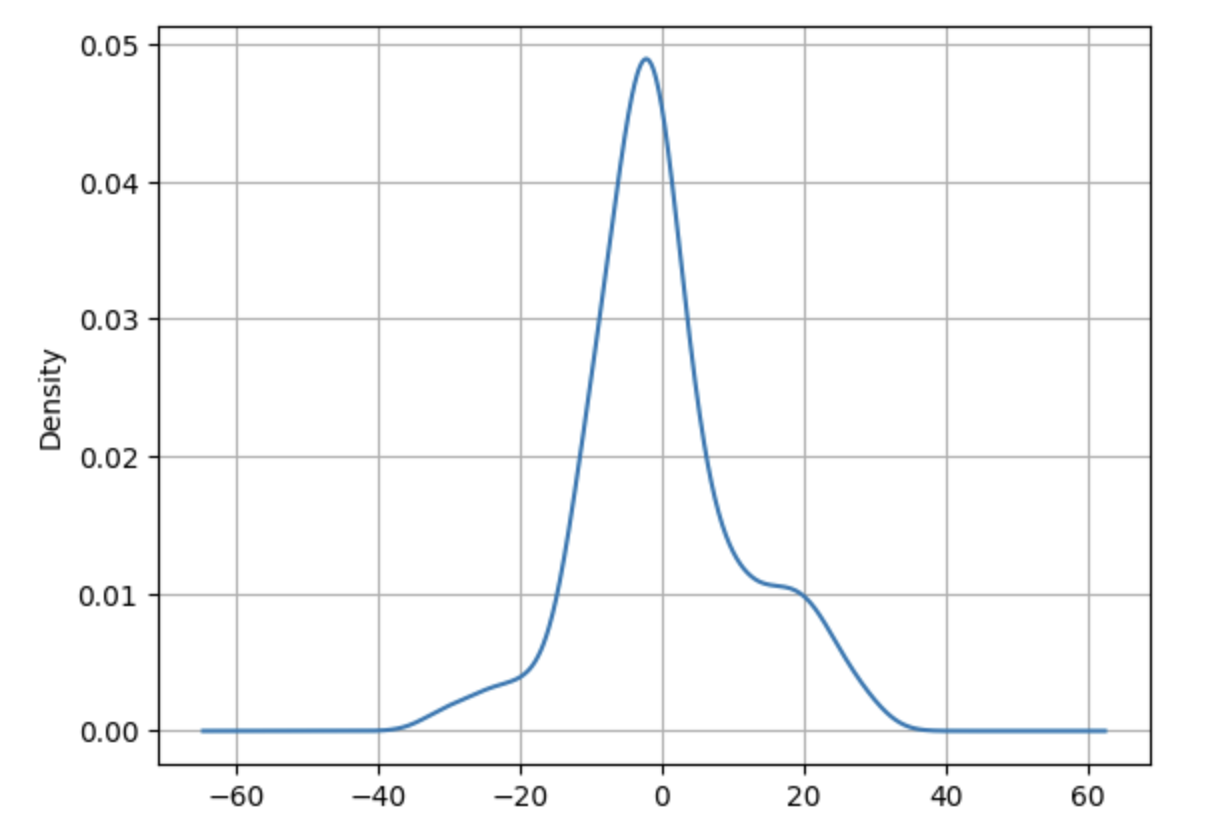
Examining the trend KDE reveals two distinct clusters, indicating the presence of two separate trends during the observed period. Similarly, the seasonality KDE shows three overlapping clusters, suggesting three distinct seasonal patterns.
In essence, counting the peaks (modes) in the trend and seasonality KDE plots provides a straightforward way to estimate the number of changes in trends and seasonalities.
And with that, we wrap up this post.
Note:
If you are interested in the code
Citation
@online{sambasivan2026,
  author = {Sambasivan, Rajiv},
  title = {Accuracy, Is That What We Are After?},
  date = {2026-04-13},
  url = {https://rajivsam.github.io/r2ds-blog/posts/accuracy_is_all/},
  langid = {en}
}